A 6th synthesis report published by the IPCC 🌍
At the end of March 2023, the IPCC (Intergovernmental Panel on Climate Change) completed its 6th cycle of analysis on the state of scientific knowledge on climate change. The first volume was published in August 2021, the second in February 2022 and the third in April 2022. More than a year later, the synthesis of these 3 volumes was published.
How are the IPCC reports organized?
The 3 volumes of an IPCC synthesis report are to be seen as 3 different doctors taking care of the same patient.
- The first doctor diagnoses the patient and scientifically understands what is going on (blood tests, MRI, etc),
- The second doctor prescribes a treatment for the patient to treat the symptoms of the disease (lowering the fever, etc)
- And the last doctor proposes a treatment to treat the root cause of the disease (doing more sport and eating healthier).
In an IPCC report, the first working group analyzes the scientific literature to propose a consensus on the state of the planet’s climate. The 2nd working group assesses the impacts of climate change on the ecosystems of which we are a part and proposes a treatment to adapt to this change. The 3rd working group assesses the possible levers to reduce warming as much as possible. It proposes the dosage and all possible treatments.
What about the 6th synthesis report?
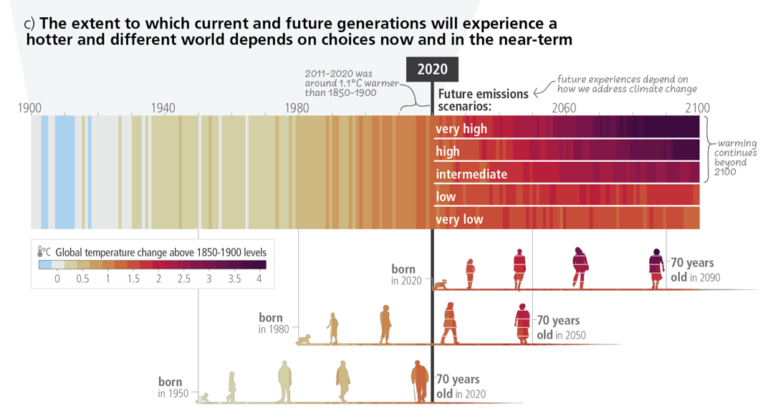
The 6th report includes an infographic that caught the attention of many people who are interested in climate issues. This infographic shows the evolution of global temperatures with the graphic design of the Warming Stripes while making the link between generations (in the same way as the Born in … ppm art project). It shows the evolution of past and future climate according to our societal choices and what it will be like for future generations.
You will find a selection of graphs and infographics from this latest report. Of course, not all topics can be covered and the treatment here is to be seen according to the author’s focus. If you want to make up your own mind, that’s what the IPCC reports are for. Here, we will discuss the learnings from this report through the 3 working groups mentioned above.
- What do we learn about the scientific consensus of the problem?
- According to the IPCC, what about the impacts of climate change on human societies?
- How to reduce our emissions to mitigate global warming?
What do we learn about the state of the world's climate?
The first learning is essential. It is a matter of establishing a scientific and intergovernmental consensus. Current climate change is unquestionably due to human activities. Whereas previous reports expressed doubts (1990) and then strong certainties (95% in 2014), the group now assumes a phrasing that does not allow for any doubt about the human origin of current global warming. On the graph below, it is clear that only the simulations including activities allow us to match the observations.
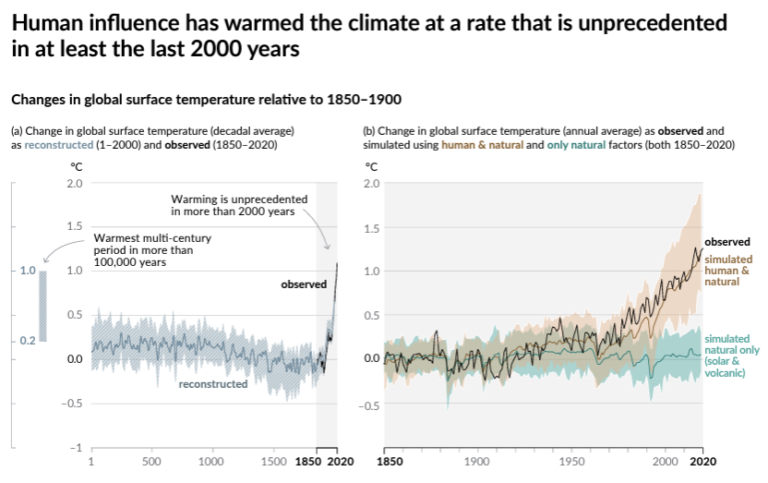
This is the best news humanity can get from its scientists. This information saves us from a Don’t Look Up scenario. Indeed, the cause of the current global warming is not an inevitability that humanity can do nothing about. Quite the contrary, and this will be the interest of the learning provided by Working Group 3 on mitigation.
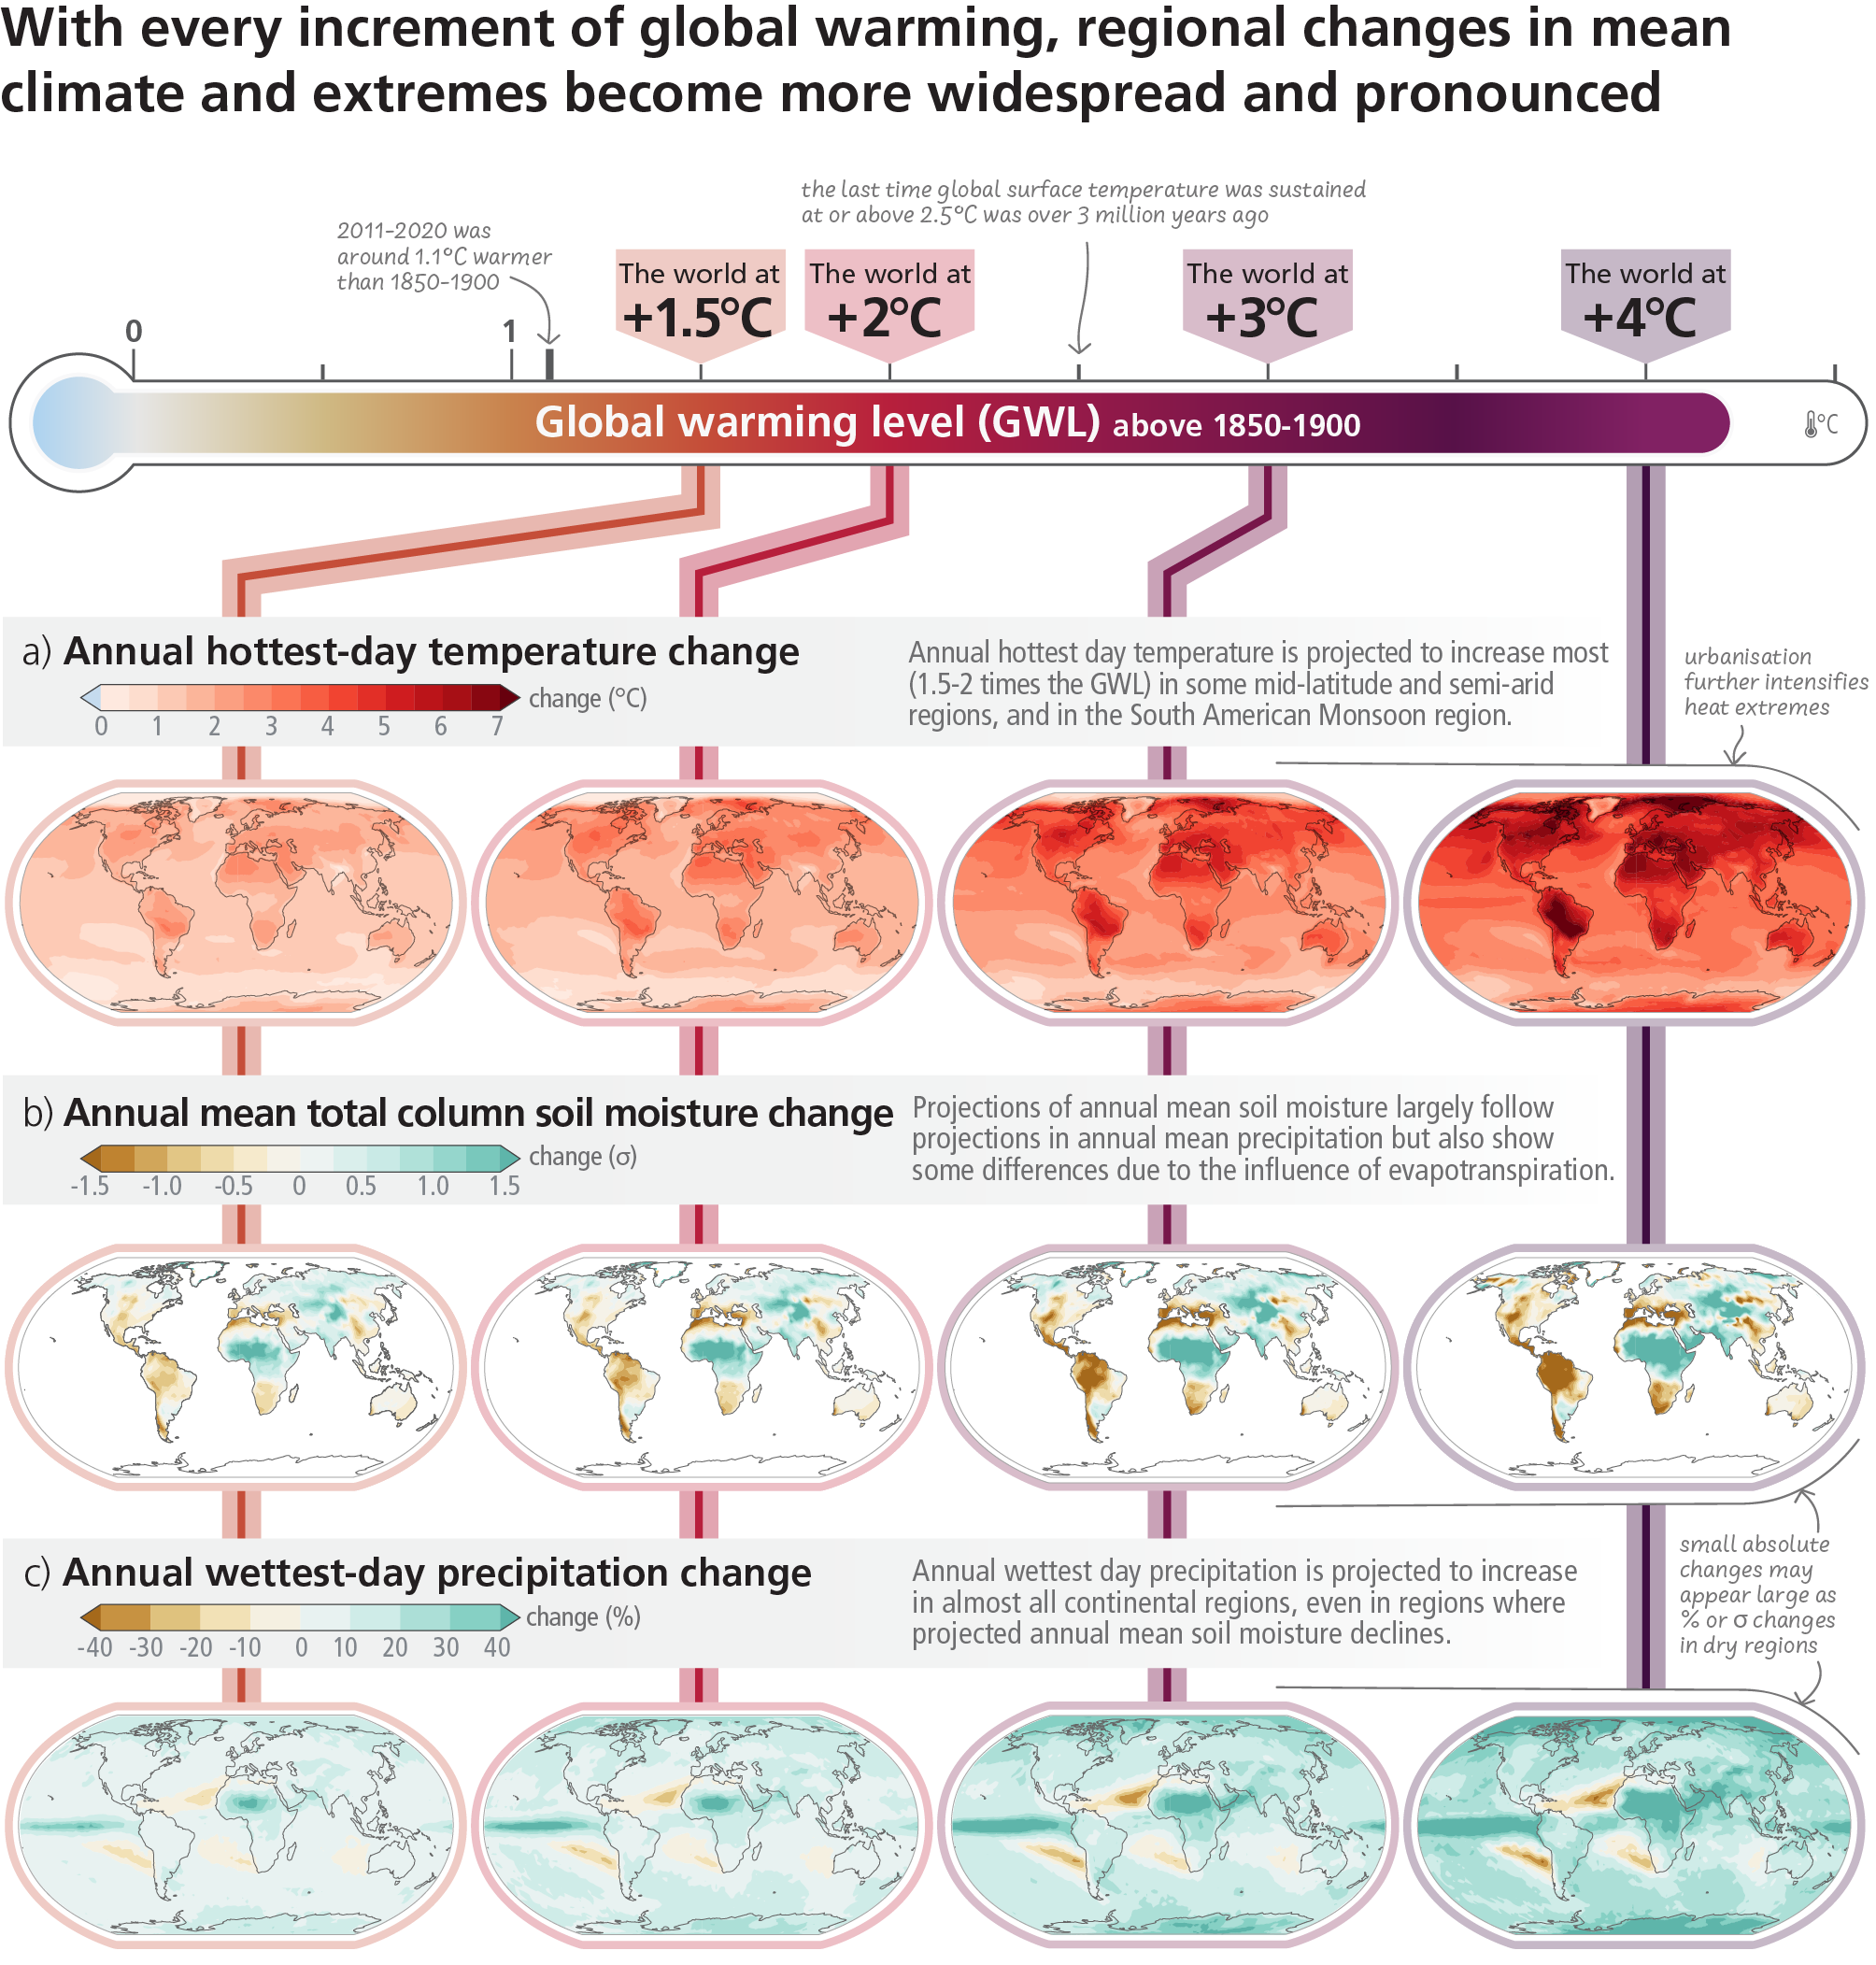
The second learning is to see as concretely as possible the consequences of a world heated by +1.5°C, +2°C, +3°C or +4°C through different consequences on our daily life.
- Variation of the maximum temperature of the hottest day of the year
- Variation in average soil moisture
- Change in the amount of rainfall on the wettest day of the year

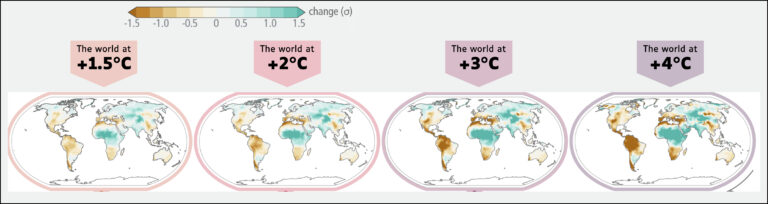
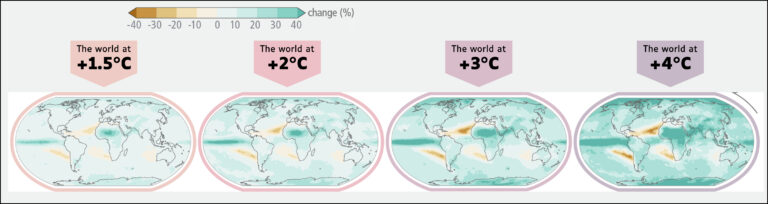
Concerning European societies, the most visible consequences are those concerning the drying up of the soil around the Mediterranean. But also the increase in temperatures amplified by the urban heat islands that are very present on our continent. For more details, regionalized data are proposed in this document.
How can we adapt to this changing climate? How to mitigate its causes?
And how is everything interconnected?
This infographic from the long version of the synthesis report (p.31) answers that question.
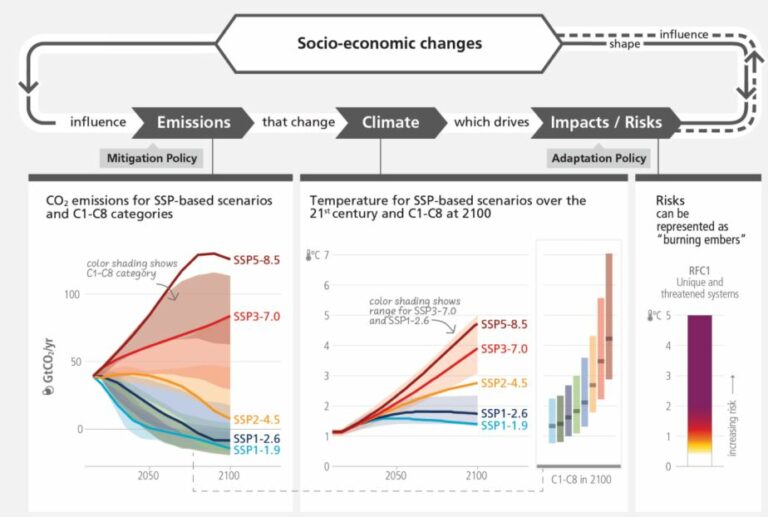
This infographic shows how the 3 themes of the 3 IPCC working groups are connected. Emissions from human societies (group 3) influence the future climate (group 1). This leads to impacts and risks that human societies experience and try to adapt to (group 2).
Adapting to a climate that will warm up for another 2 decades
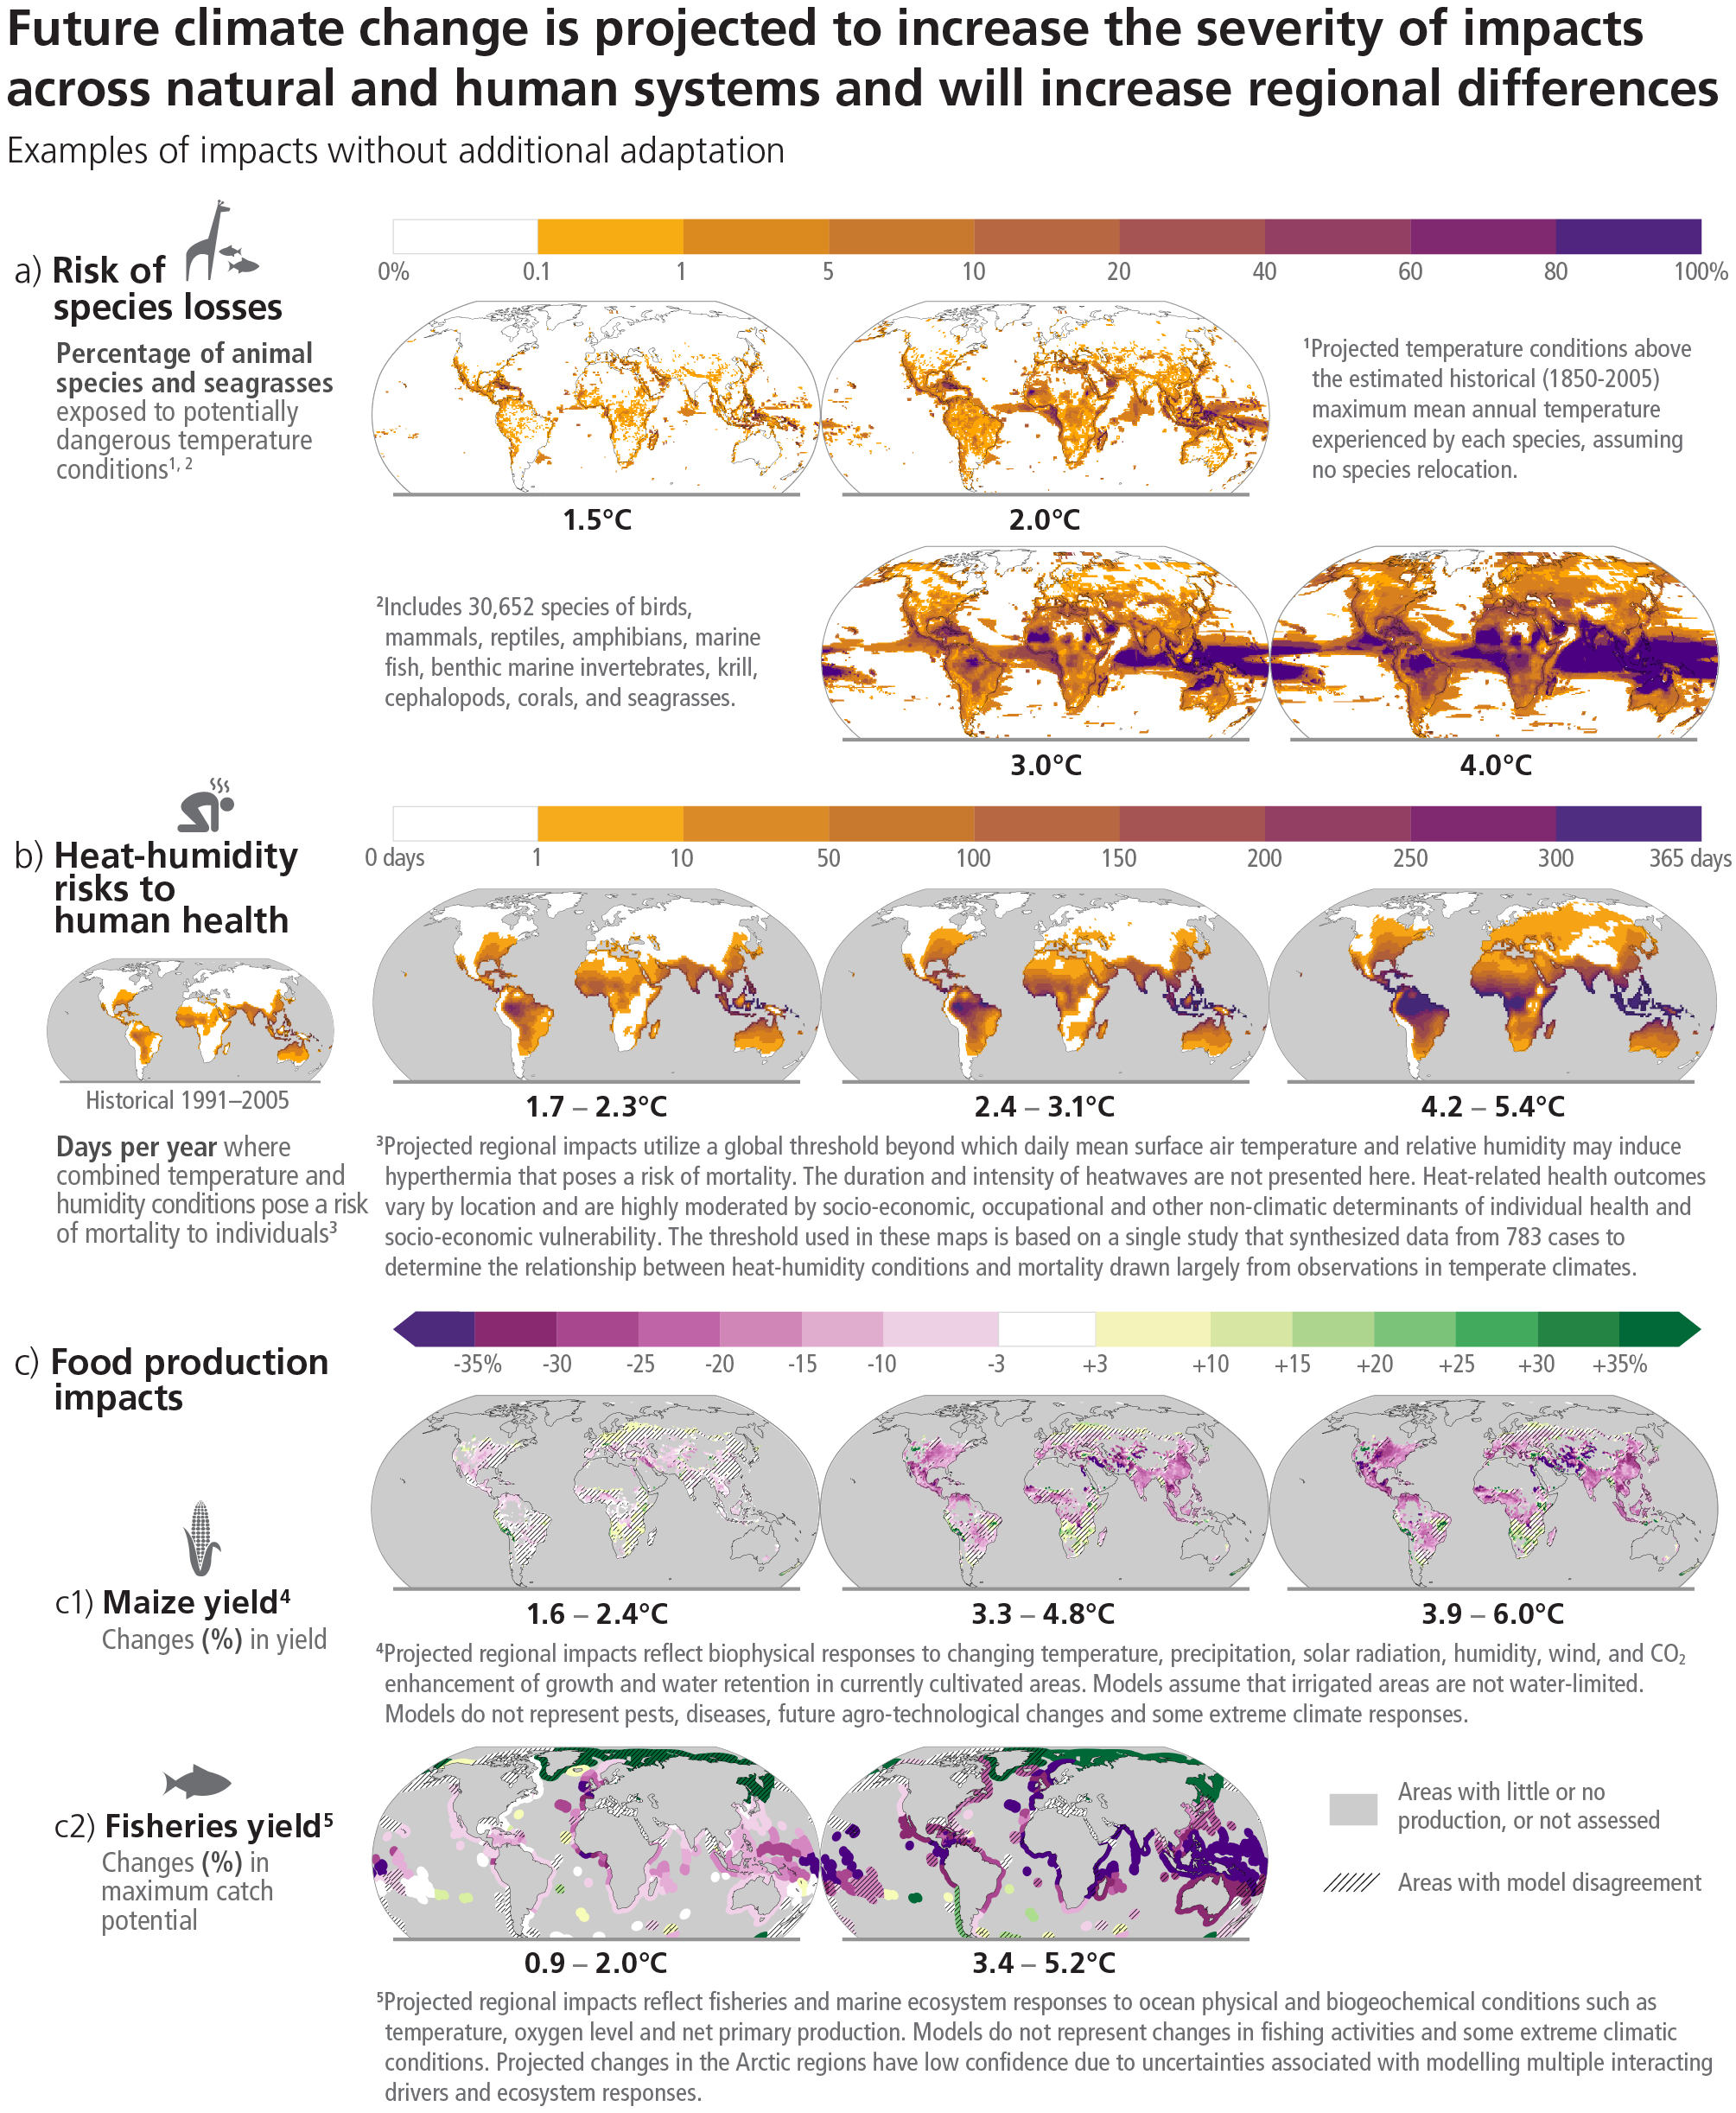
The IPCC website is full of infographics to help you understand its reports. In particular, there are graphs on the impacts of climate change at different temperatures (based on the same logic as the three presented above).
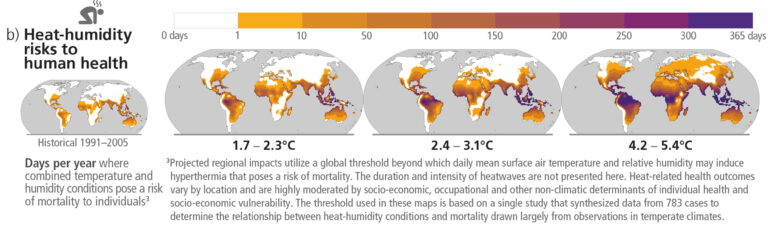
It can be seen in this infographic that the number of days that increase human mortality increases significantly as warming continues. The purple areas on the infographics are those where people are experiencing health-threatening weather conditions 365 days a year. This is one of the learnings from Group 2: detecting the impacts of climate change on our societies.
It is particularly interesting to see on this graph that the equatorial band, the most densely populated area of the planet, is the one that will experience the harshest climatic conditions for the human body.
But Group 2 is also working to evaluate solutions for adapting to this changing climate. It is in this sense that it proposes an infographic (summary report, long version, p.45) to make visible the challenges of adapting to rising sea levels on the coast.
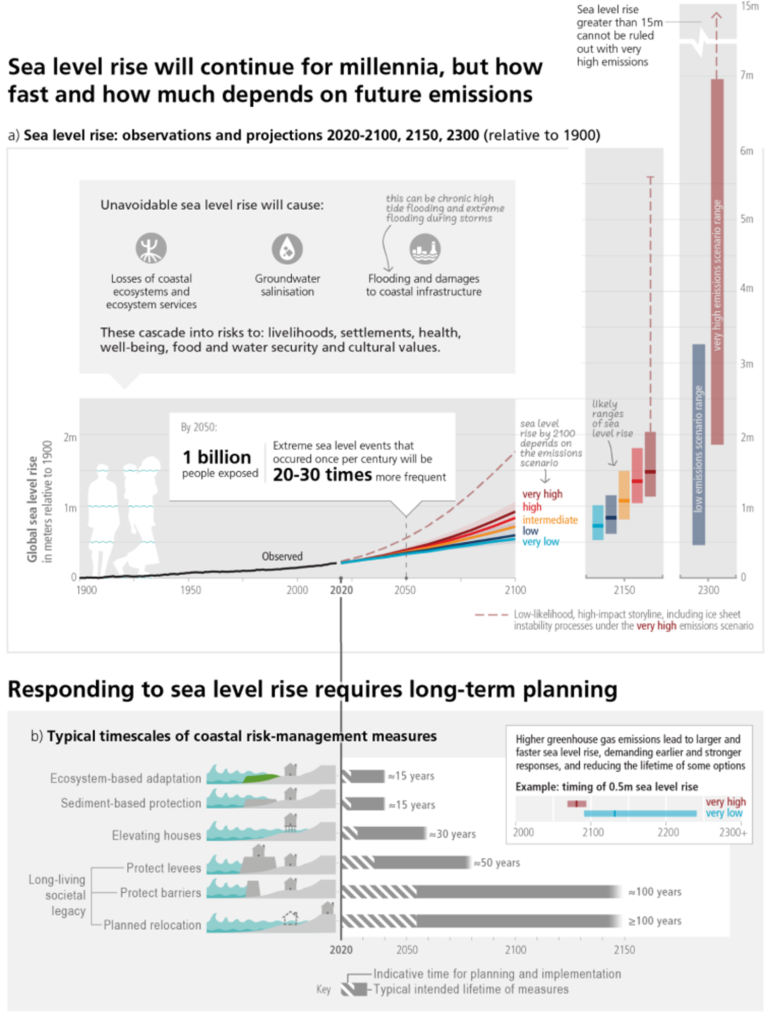
It provides some orders of magnitude on the impacts of rising sea levels on human populations. But this infographic also sheds some interesting light on the evaluation of adaptation solutions to rising sea levels and their duration of effectiveness given the inexorable rise in sea levels until at least 2300. In particular, it shows that only solutions for relocating coastal dwellings can meet the long-term challenges of rising sea levels.
In the same way as for Group 1, regionalised data is available on this site. This is very useful to know which impacts will be more frequent and intense at which points in the value chain of a company.
Turning off the gas to limit the fire: mitigation policies
Group 2 is working to assess the possibilities of adapting to a changing climate. However, there are hard limits, physical limits, to which it is no longer possible to adapt once they have been reached. This is why the 3rd working group plays a key role. Its mission is to find and evaluate the levers to limit global warming as much as possible by achieving carbon neutrality.
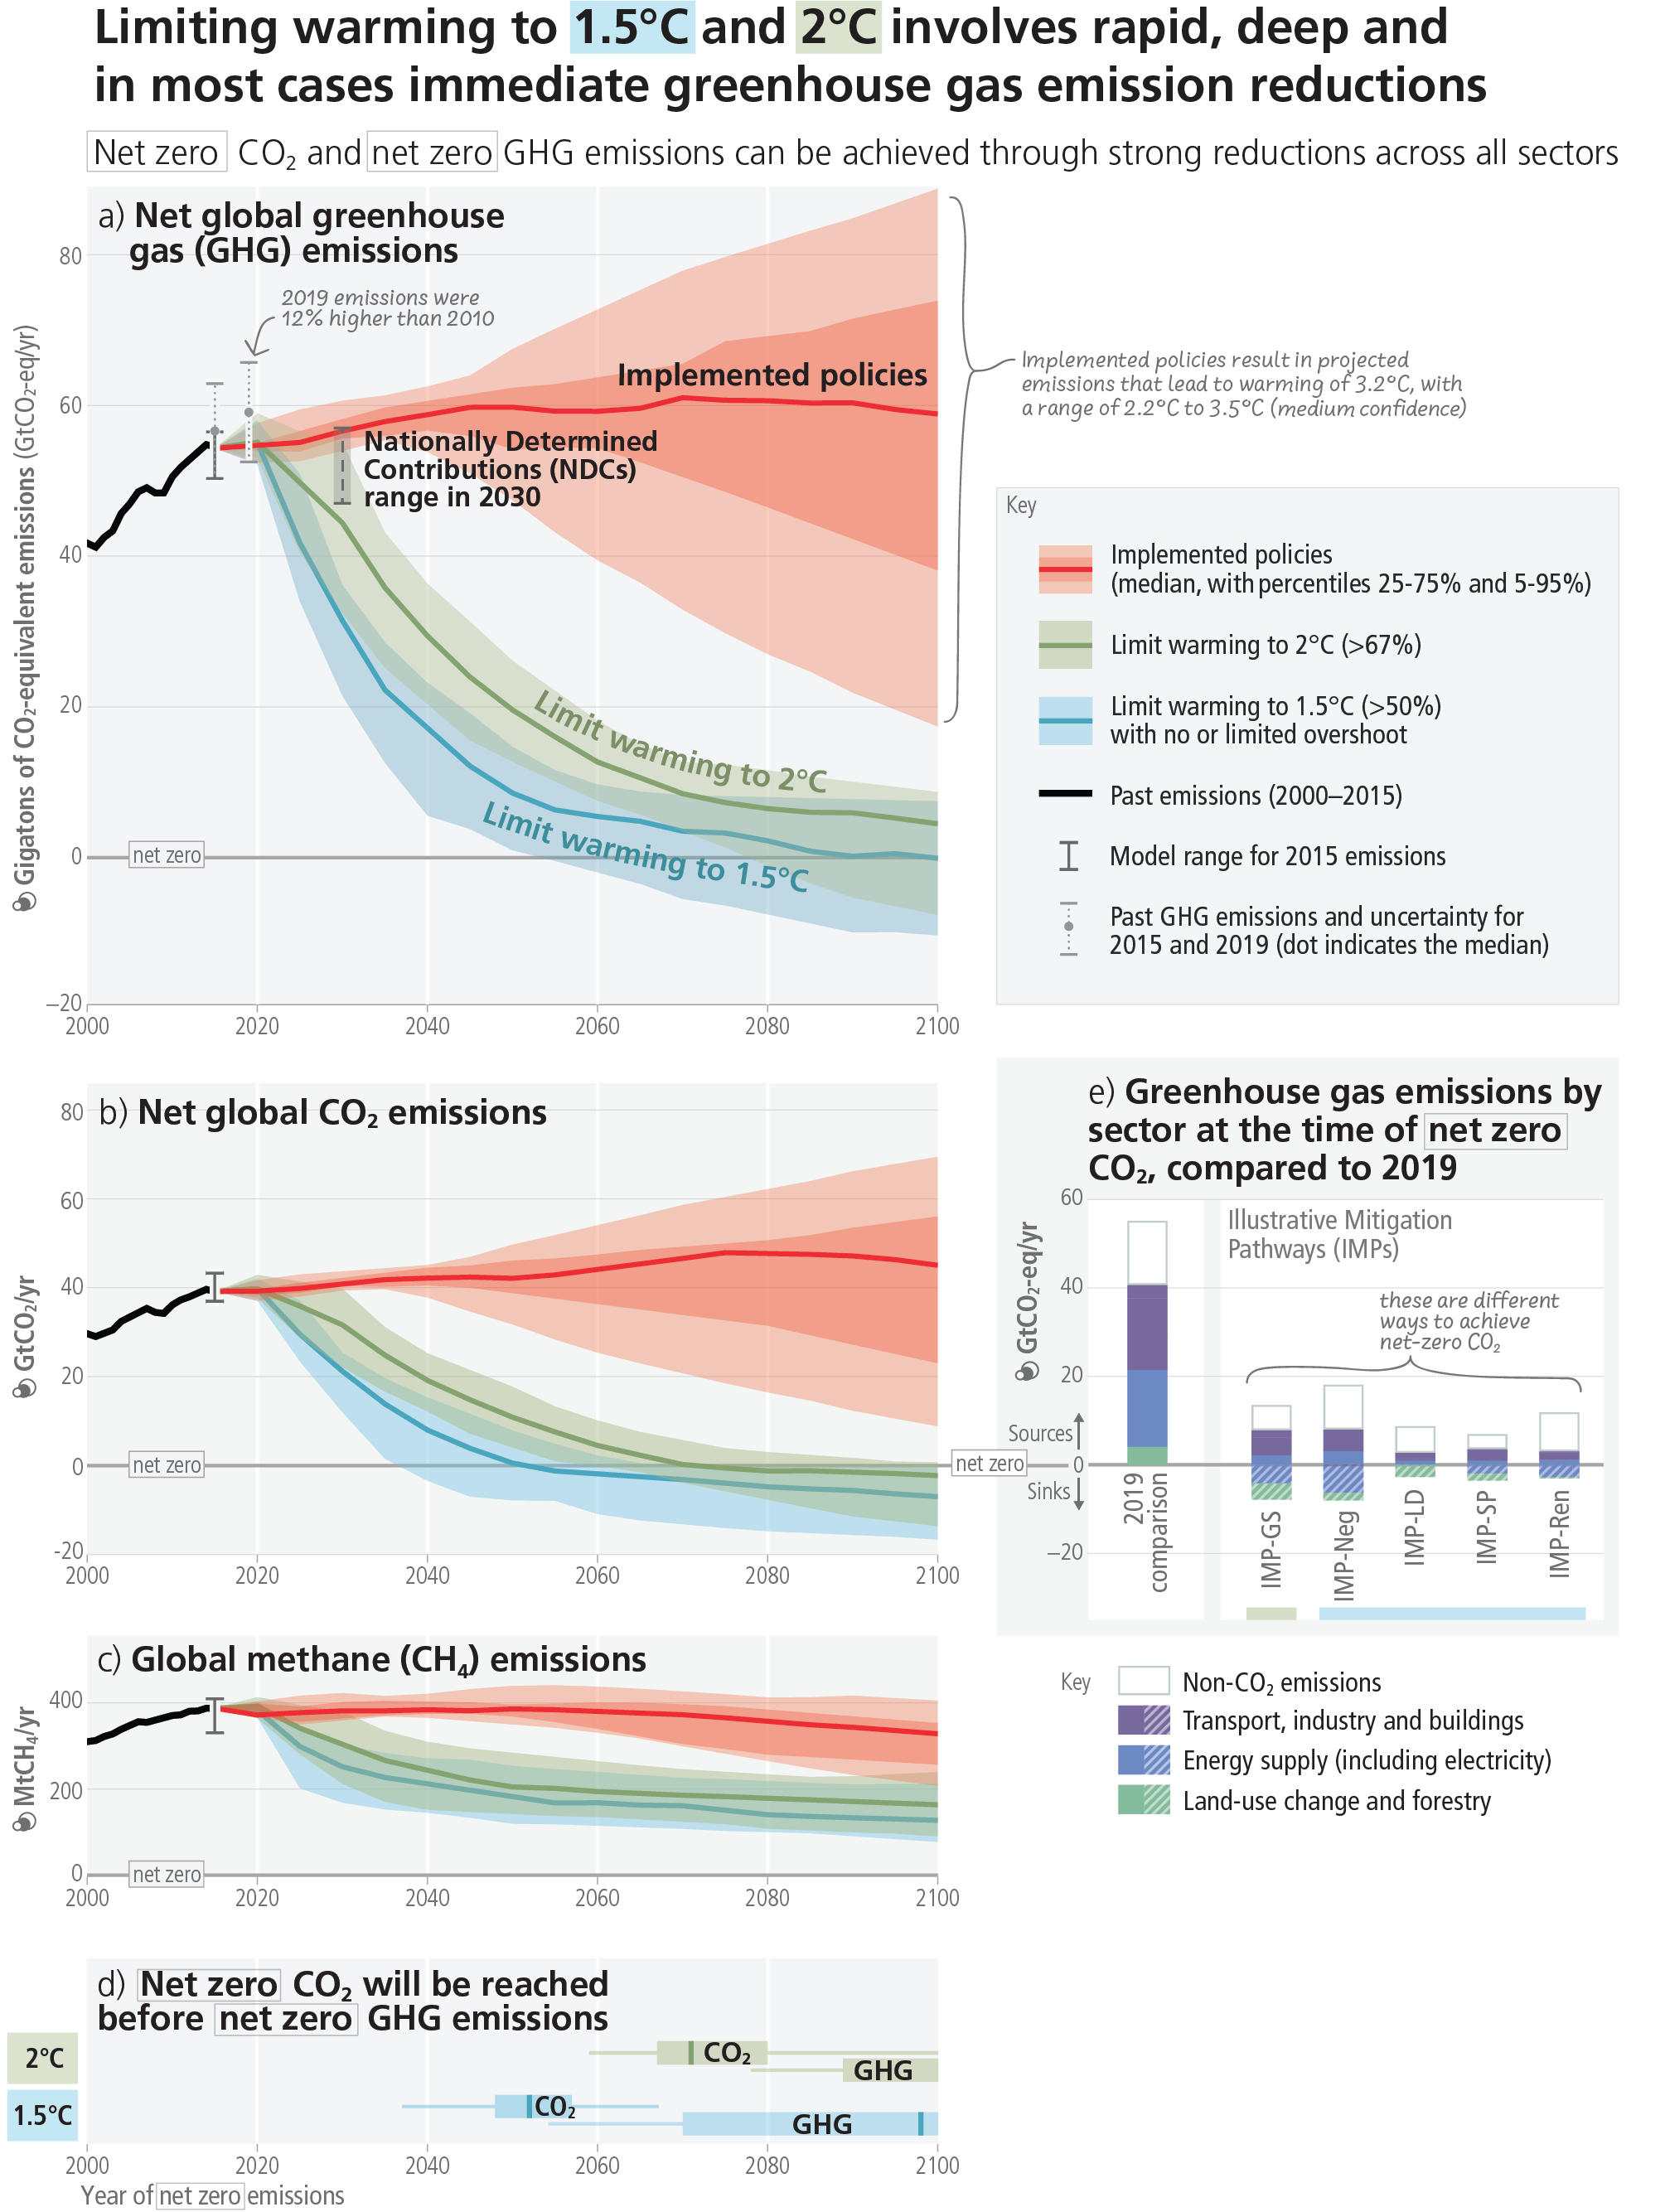
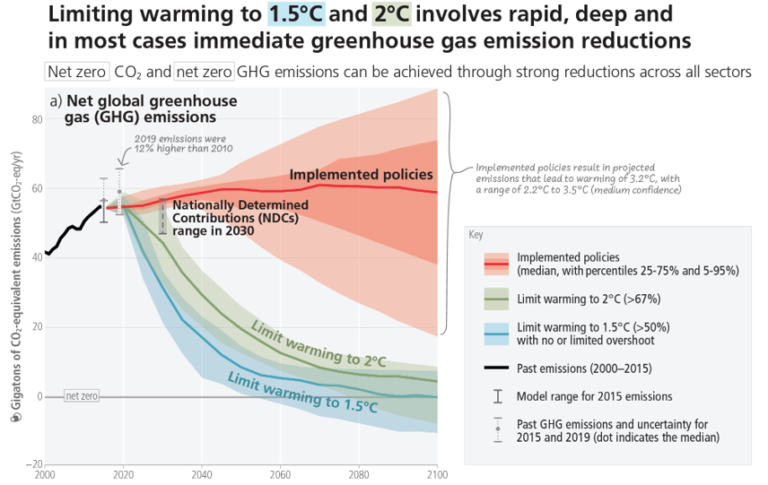
The 3rd working group takes the data from governments about their climate commitments and feeds it into its models and the graph below is the result. We can see the delta between the slopes that our GHG emissions must take versus the slopes that governments are willing to accept. Currently, political commitments are taking us towards a world that is +2.2°C to +3.5°C warmer by 2100, which will have consequences as mentioned above. We will discuss below the potential reasons for this outcome.
In order to facilitate the achievement of the climate objectives (limiting warming to 1.5°C by 2100), this group 3 gives all the possible levers. They evaluate the evolution of the costs of the various technologies likely to be useful in the transition. They evaluate the different forms of action to reduce our GHG emissions, such as technological innovation, process efficiency and sobriety. They also propose sectoral trajectories on which organizations can align themselves in order to move forward together in the transition.
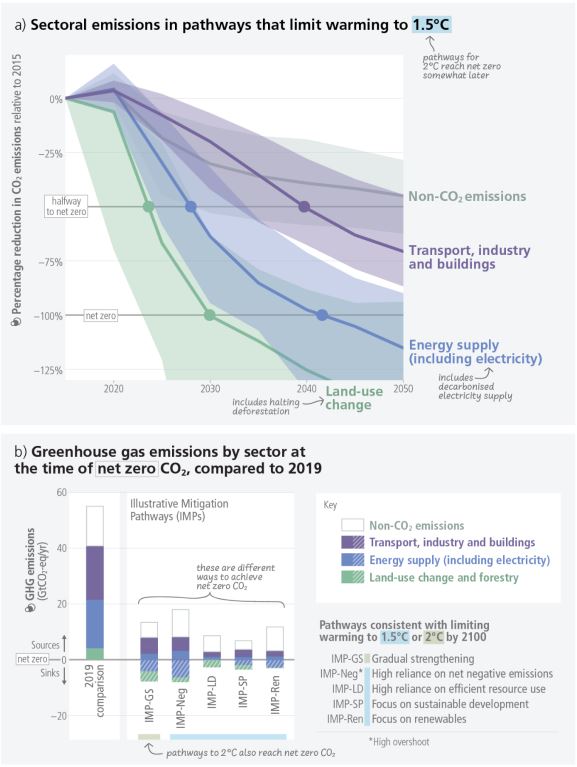
With these 5 scenarios proposed to achieve carbon neutrality, the IPCC also provides sectoral details where we can see that some sectors must take stronger emission trajectories than others. This is particularly true for agriculture, which is strongly linked to changes in land use at the global level.
What can we conclude from this new report?
Since 1988, the group has published 6 synthesis reports and 12 special reports that have been very enlightening on the state of our planet’s climate and possible futures. This has helped to build scientific consensus on the subject and to bring climate issues into the public sphere.
But this has still not allowed us to respond to the issues at stake. And this is most likely due to the governance of the IPCC, which is an intergovernmental group.
How does the IPCC work?
The result of the reports is a truth that does not disturb, that does not challenge the political and economic power relations. The same insufficient result occurs because scientists have to agree on a consensus that leads them to discard the most divisive proposals.
The result of the reports is a truth that does not disturb, that does not challenge the political and economic power relations. The same insufficient result occurs because scientists have to agree on a consensus that leads them to discard the most divisive proposals.
This latest report does not fundamentally tell us anything new about the state of the planet or the most effective levers of action. It does, however, confirm a large number of issues, assumptions and certainties. But that’s not what 2023 is about anymore.
What we have to do ...
In 2023, the aim is to emulate the people of the 1980s. As the hole in the ozone layer became more and more visible, they all took action to popularize scientific discourse and educate decision-makers about the issues.
The IPCC will not make us take action. Only governments and companies can. And to a lesser extent, individual citizens.

Auteur :
Harald Lhomme
Consultant en stratégie climat