How have energy mixes evolved? What levers should be activated to best initiate the energy transition?
In the previous article of this series dedicated to energy transition, we mentioned the importance of energy mixes as a first step in understanding the causes of our CO2 emissions.
We propose here to develop the theme of energy mixes and to make the link with our best tools to reach our climate objectives: the levers for decarbonation.
It all starts with our energy choices!
We will do an analysis at the state level because the data is more easily accessible and more representative. However, each organization (company, association, citizen) can do the same comparative work.
First, let’s look at where our emissions come from.
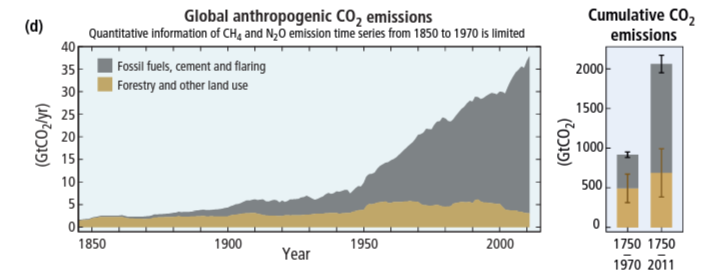
In 2010, humanity emitted about 35 billion tons of CO2. Of which 30 billion came from the combustion of fossil fuels and the manufacture of cement.
As presented in the article entitled The History of Energy Transition, these fossil resources are burned in order to use their energy potential. They can then be considered as energy of fossil origin.
Human (anthropogenic) CO2 emissions are mainly due to the combustion of fossil resources. This combustion can be used for different purposes such as :
Moving a vehicle
Heating
Producing electricity
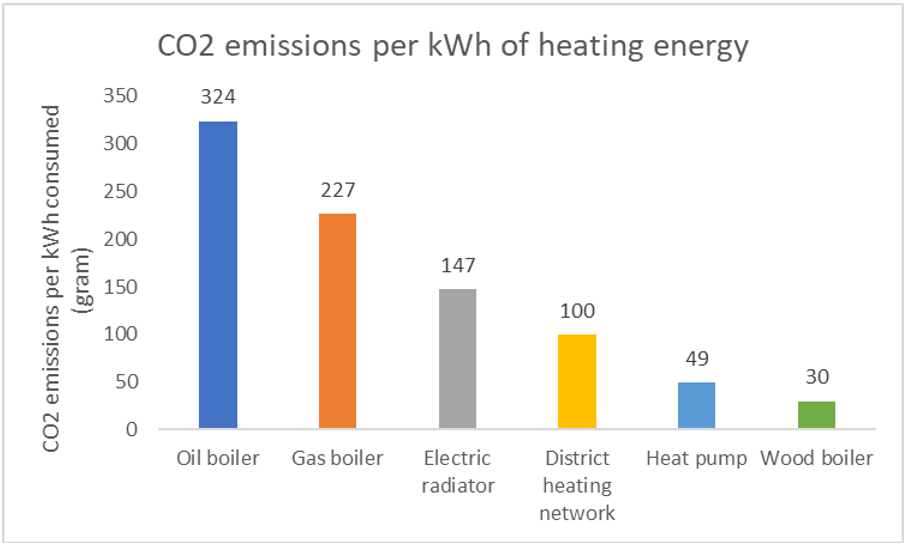
Let’s compare the different solutions for heating and for producing electricity along a particular axis: the amount of CO2 emitted to produce 1 kWh of heating energy or to consume 1 kWh of electrical energy.
Carbon intensity of heating systems. Source [ author from ADEME datas]
To generate heat, we have different solutions. Very often, we heat with oil in the countryside and with gas in the city. The reason being simply that the deployment of a gas network is more economical in dense areas.
Heating methods based on fossil fuels (oil and gas) are the most carbon intensive.
To reduce your carbon impact while having the same service (1 kWh of energy to use), changing your heating mode is a first solution.
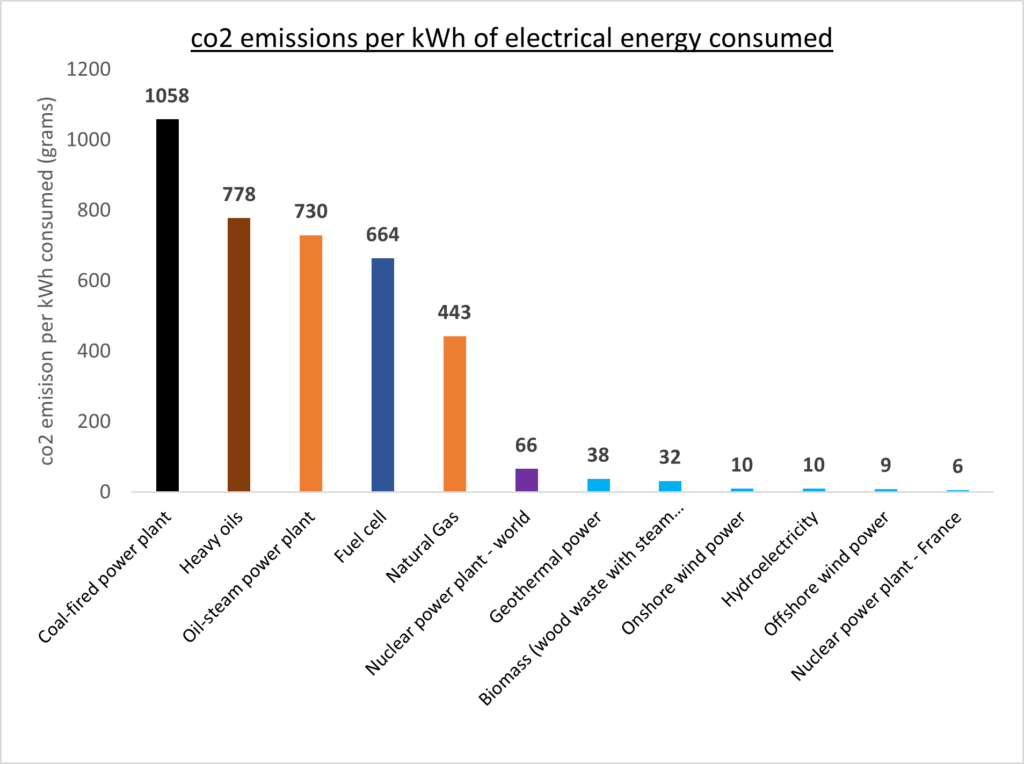
The same reasoning applies to electricity.
Producing electricity with fossil resources turns out to be the most emissive mode.
Again, changing the source of production for our electricity reduces our CO2 emissions for the same service (1 kWh of electrical energy).
Carbon intensity of electricity generation source modes. Source [author from ADEME data]
These two examples show that the choice of energy sources can have a major impact on CO2 emissions. The analysis of the energy mix therefore allows us to quickly get an idea of a country’s CO2 emissions.
As a reminder, the energy mix is the breakdown of the different energies used by a system (often analysed at country level).
How are our energy choices evolving?
We will do an analysis at state level because the data is more easily accessible and more representative. However, each organisation (company, association, citizen) can do the same comparative work.
But what can these energy mixes tell us? Can we make them talk?
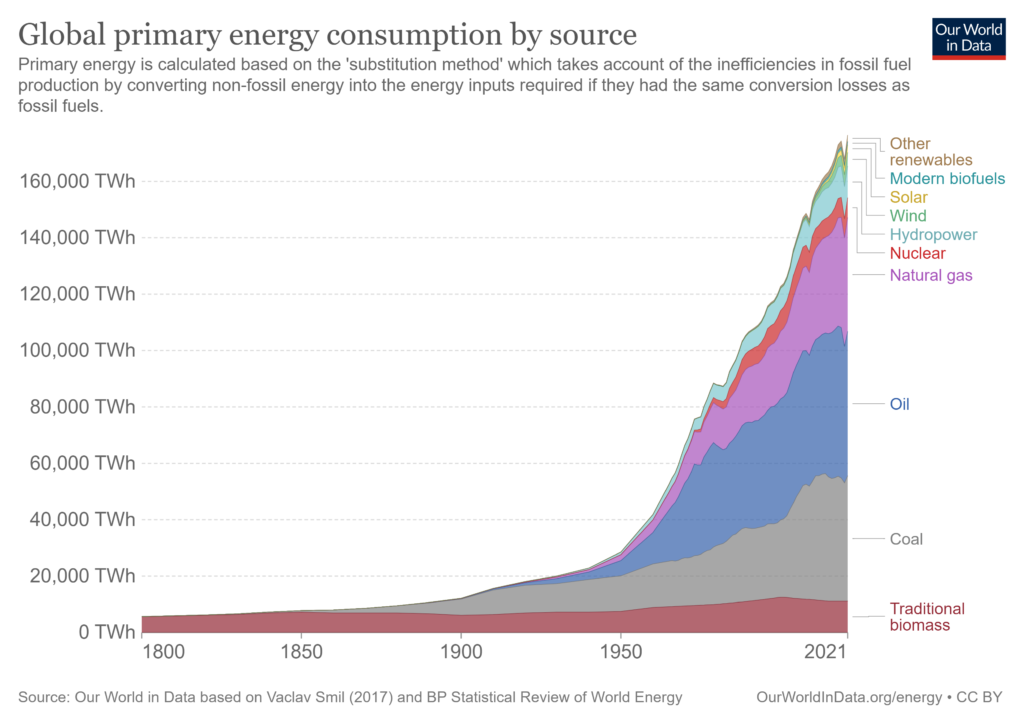
The evolution of the global energy mix since 1800 allows us to see several things:
The industrial revolution [1850] started with coal
The 30 glorious years [1945 -1970] can thank oil
Nuclear power appeared following the oil shocks of 1970
Coal has been on the rise since the 2000s because of … surprise. We’ll see soon enough 🙂
Renewables are almost invisible but have been booming since the 2000s
Evolution of the world energy mix. Source [Our world in data]
Let’s now go into a country-by-country analysis to derive more precise analyses.
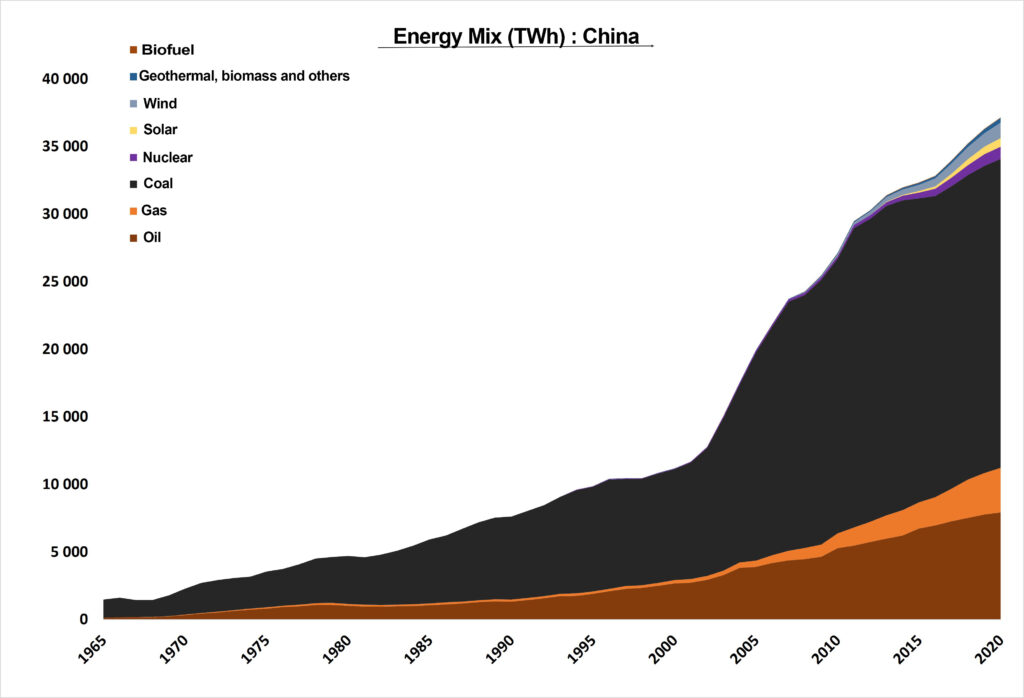
China's energy mix. Source [Author on data from BP statistical Review 2021]
1. THE CHINESE ENERGY MIX
Answer to the previous surprise: the Chinese economic boom of the 2000s was made possible by the intensive use of coal.
The country now has half of the world’s open coal-fired power plants.
Of course, China has become the world’s factory and the use of this coal allows Western countries to import from China.
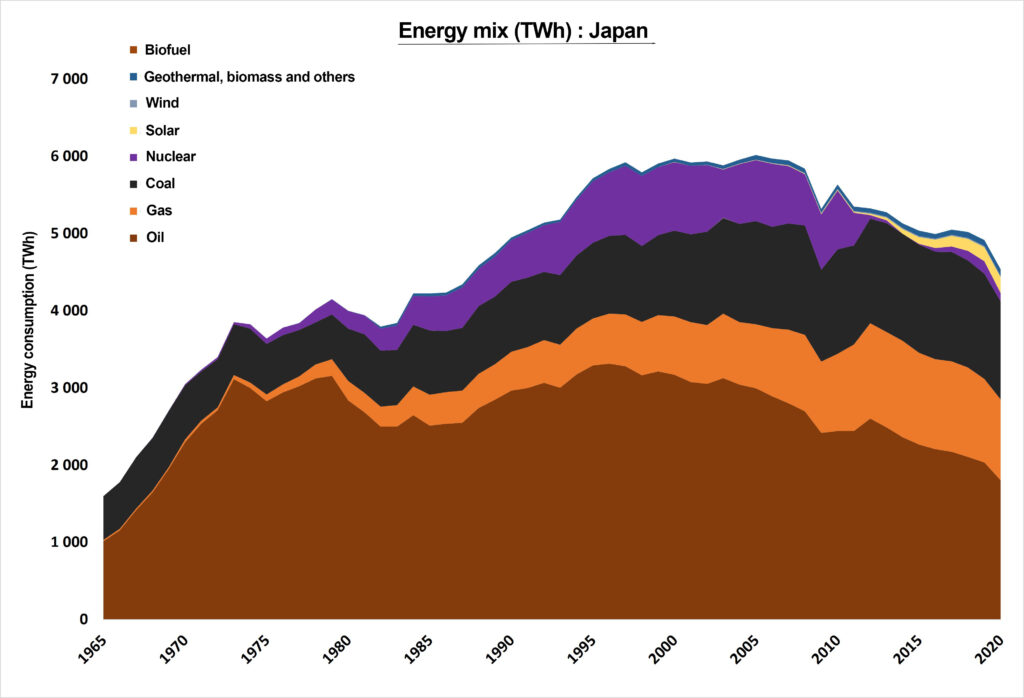
Japan's energy mix. Source [Author on data from BP statistical Review 2021]
2. THE JAPONESE ENERGY MIX
The Asian neighbor, Japan, experienced its economic boom during the 30 Glorious Years with a predominant use of oil. Following the oil crises of the 1970s, Japan developed nuclear power.
Japan’s energy peak occured in 2005, mainly due to a decreasing use of oil.
In 2011, Japan closed its nuclear programme following the tsunami and its consequences on the Fukushima plant. Nuclear power represented 13% of the primary energy used by Japan.
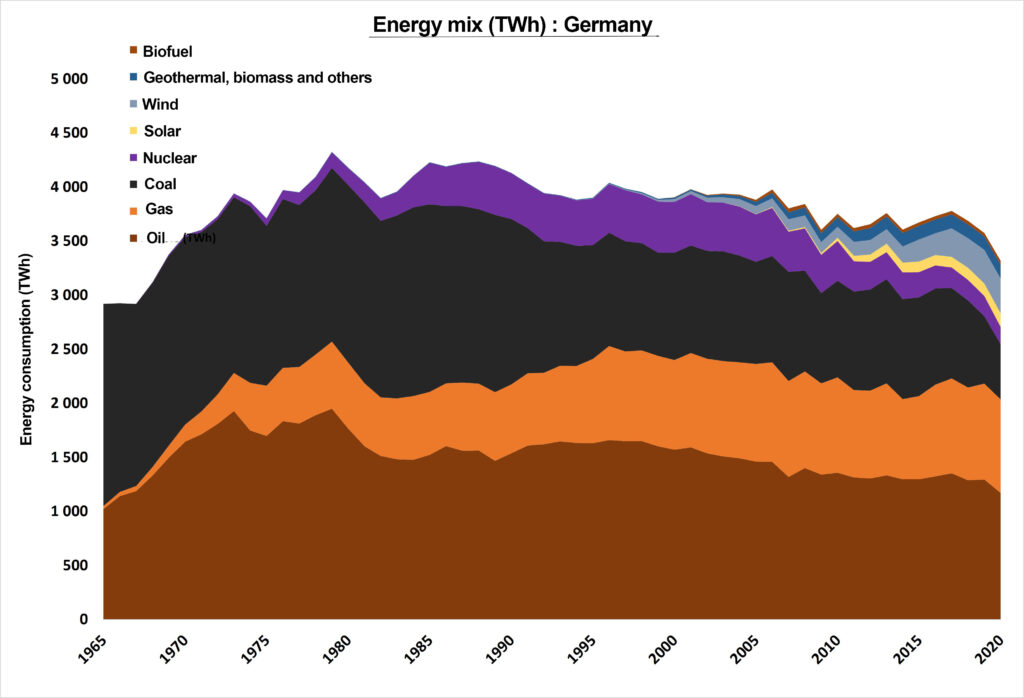
Germany's Energy Mix. Source [Author on data from BP statistical Review 2021]
3. THE GERMAN ENERGY MIX
Our German neighbor experienced an economic boom during the 30 Glorious Years with a significant use of coal.
The development of nuclear power accelerated following the oil crises of the 1970s. As in Japan. What do these two countries have in common?
Germany’s energy peak came in 1980 with a drop in coal and oil consumption.
Following the Fukushima accident, the country decided to gradually phase out nuclear power. Its share in the energy mix fell from 10% to 5%.
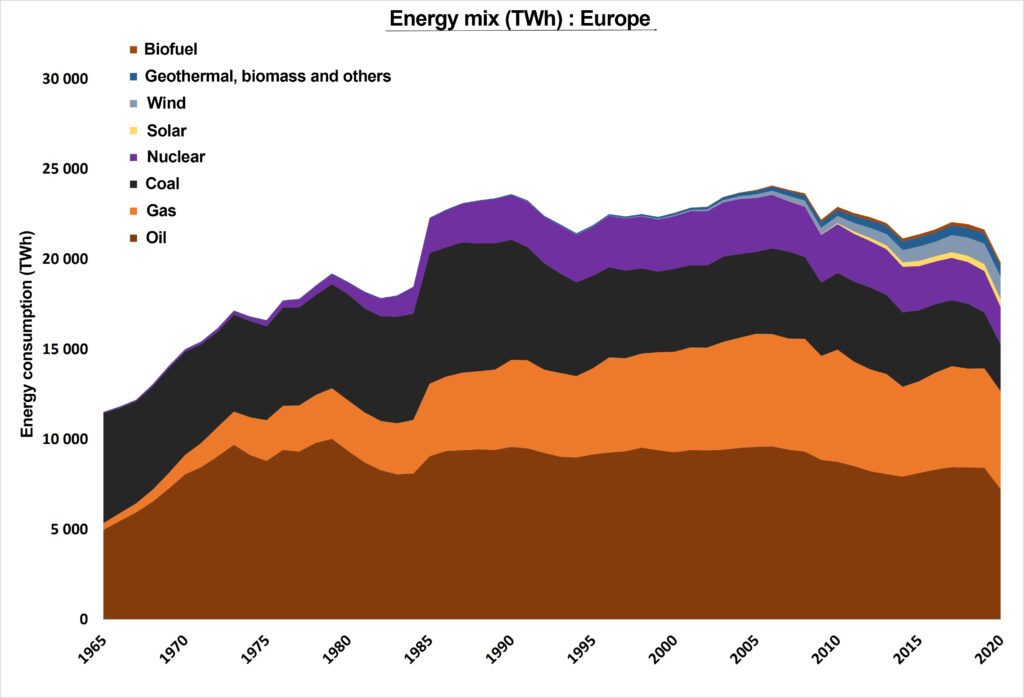
4. THE EUROPEAN ENERGY MIX
If we look at Europe (geographically), we can see that its development during the 30 Glorious Years was linked to the consumption of coal and oil.
Here too, the development of nuclear energy is felt from the oil shocks of the 1970s onwards.
The maximum amount of energy consumed by Europe was reached in 2006 with the decline in oil consumption.
NB: The rebound of the years 1985-1990 is due to the incorporation of the countries of the former USSR into the Europe category.
Europe's Energy Mix. Source [Author on data from BP statistical Review 2021]
What can we learn from the analysis of these energy mixes?
The evolution of the energy mixes has taken place at the same time as the economic evolution of countries. The massive use of energy has enabled the economic development of countries that have had access to this energy. The energy transition must therefore not be thought out of the ground but linked to the real economy of countries.
How to achieve energy transition in France ?
We specify the case of France but the methodology is applicable to every country, company or individual.
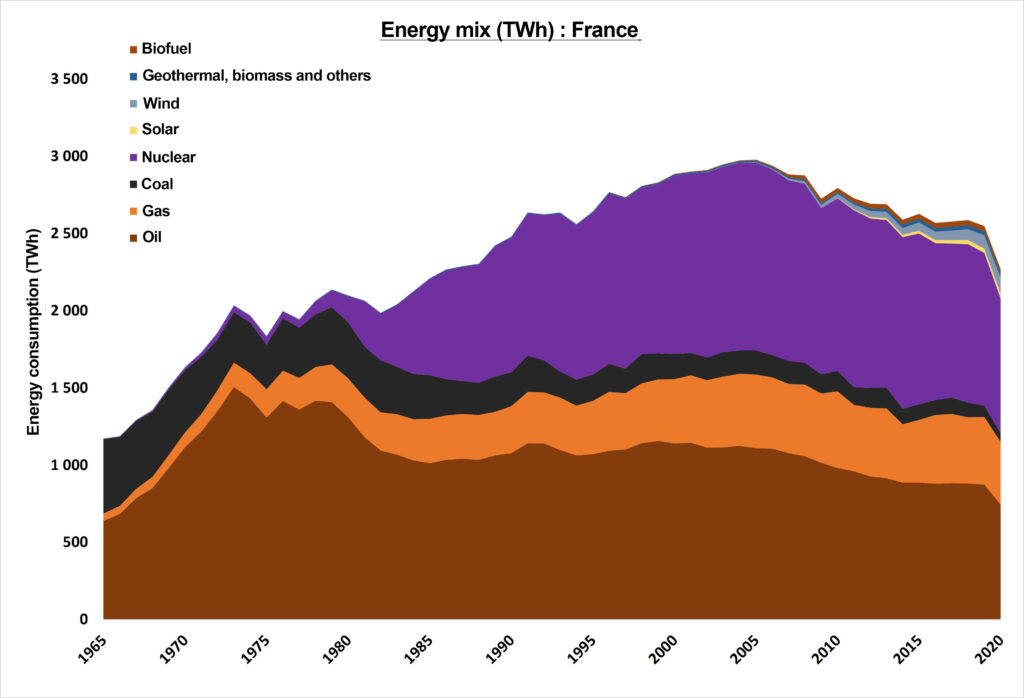
France has relied heavily on nuclear power since the 1980s (following the first two oil crises). It is not the only one to have ideas, but it is the only one to have succeeded in incorporating so much nuclear power into its energy mix.
The French energy maximum was reached in 2005 with the decrease of oil, gas and nuclear consumption.
France's Energy mix. Source [Author on data from BP statistical Review 2021]
This is the situation in the early 2020s. Now we have to achieve our energy transition objectives.
To this end, the French government has adopted a strategy to achieve carbon neutrality by 2050.
choice of less CO2-intensive energy sources (which we mentioned earlier)
energy efficiency
sobriety
IThe use of the three previous levers should make it possible to achieve carbon neutrality in France in 2050. To achieve this, emissions must be reduced from 460 MtCO2e to 80 MtCO2e. A reduction of around -5%/year to reach a total of -80% in 30 years.
In order to achieve carbon neutrality, the public debate focuses almost exclusively on the first lever. The decarbonisation of energy carriers.
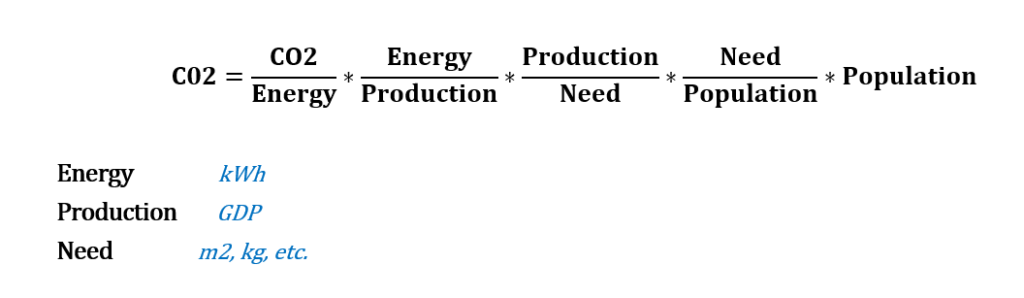
Let’s link these 3 levers around a simple “equation” in order to have a better overview.
The identity opposite, called Kaya Identity and revisited by Cédric Ringenbach, shows the 3 levers identified to achieve the transition.
The term CO2/Energy refers to the decarbonisation of energy carriers.
Energy/Production relates to energy efficiency.
Need/Population refers to the objective of chosen sobriety.
Kaya identity revised. Soucre [Cédric Ringenbach]
Energy efficiency is a lever that has been used extensively since the 1980s and the appearance of the first oil shocks. It involves optimising energy consumption to obtain the same level of service. It is above all a matter of optimisation for the engineers. There are many examples: insulation of buildings, eco-design, optimisation of industrial processes or improvement of vehicle aerodynamics.
Sobriety is positioned at the level of needs. Do I need to travel by car (~1,200 kg) to cover 5 km or can I do it by bike (~20 kg)? I use less energy for the same service. Do I need to buy a new piece of clothing or do I need to repair my old one?
These questions can be asked at the individual level, but they can also be asked at company level.
Does my customer need new tyres or does he need to drive for miles? Does my customer need a new phone or just a repair? Does the machine I am selling need that much metal?
The activation of these three levers in order to achieve the objectives of the French energy transition is likely to bring jolts to the functioning of our economy with, in particular, more or less strong variations in activity in certain sectors which will necessarily impact the employment market.
The energy transition will only be achieved if all the country’s driving forces are coordinated in the achievement of this objective. To coordinate different entities, a plan shared by all is needed.
This is what The Shift Project proposes in its Plan for the Transformation of the French Economy. A plan that visualises the path needed to achieve carbon neutrality by 2050, sector by sector.
We only use necessary cookies and one cookie to improve your user experience: the one which automatically chooses your language. By continuing your navigation through this website, you're accepting these cookies.
![Photo de l'auteur [Harald Lhomme]](https://caristeo.com/wp-content/uploads/2022/04/hlhomme-pro-noir_et_blanc-buste-1024x987.jpg)