Why shall we accelerate on transitionning our energy supply ?
Why is this transition necessary? What is the link with global warming?
In the first article of this series (available here) we talked about the history of energy in order to shed the light on the upcoming worksites. What are the objectives of energy transition to fight against global warming? The European Commission has proposed concrete actions in a plan called “Fit for 55” with the following objectives :
Reduce greenhouse gas emissions by 55% by 2030 compared to 1990 levels
Achieving carbon neutrality by 2050
We will start from these ambitions to address different aspects of energy transition.
First, we will try to understand why it is necessary to reduce our greenhouse gas emissions. Then we will discuss the energy mix existing in some countries and finally zoom in on the French strategy in terms of energy transition.
Why shall we reduce our greenhouse gas (GHG) emissions?
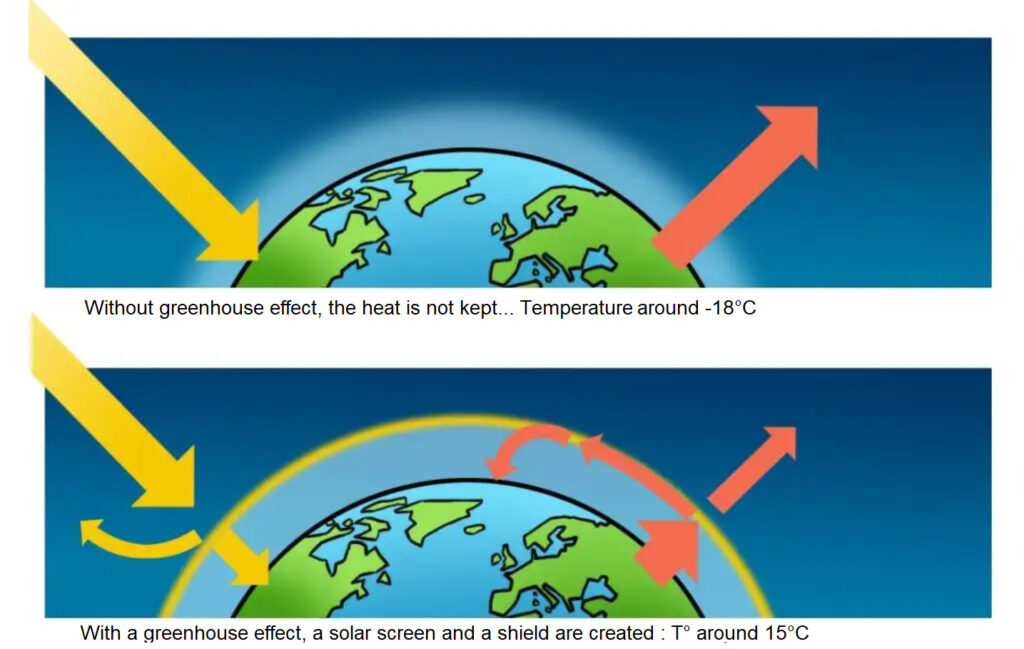
The greenhouse effect is a natural phenomenon. Thanks to the water vapour contained in the Earth’s atmosphere, the temperature on Earth is close to 14°C and thus allows life. Without it, the blue planet would have no oceans and an average temperature of -18°C.
The greenhouse effect (shown here) is similar to the effect of a sleeping bag when you are camping in the wilderness. The bag is not a source of heat, but it does help to reflect your own heat back to you. It prevents heat loss to the outside. The thicker your sleeping bag, the more heat it reflects back to you and the more useful it is.
This is what happens with the Earth and its atmosphere. The more greenhouse gases the atmosphere contains, the more it prevents the Earth’s heat from going to space.
The greenhouse effect is a natural phenomenon and it allows life on Earth.
The study of the concentration of greenhouse gases in the atmosphere gives a good indication of the functioning of our planet. CO2 is an important greenhouse gas and is measured by scientists.
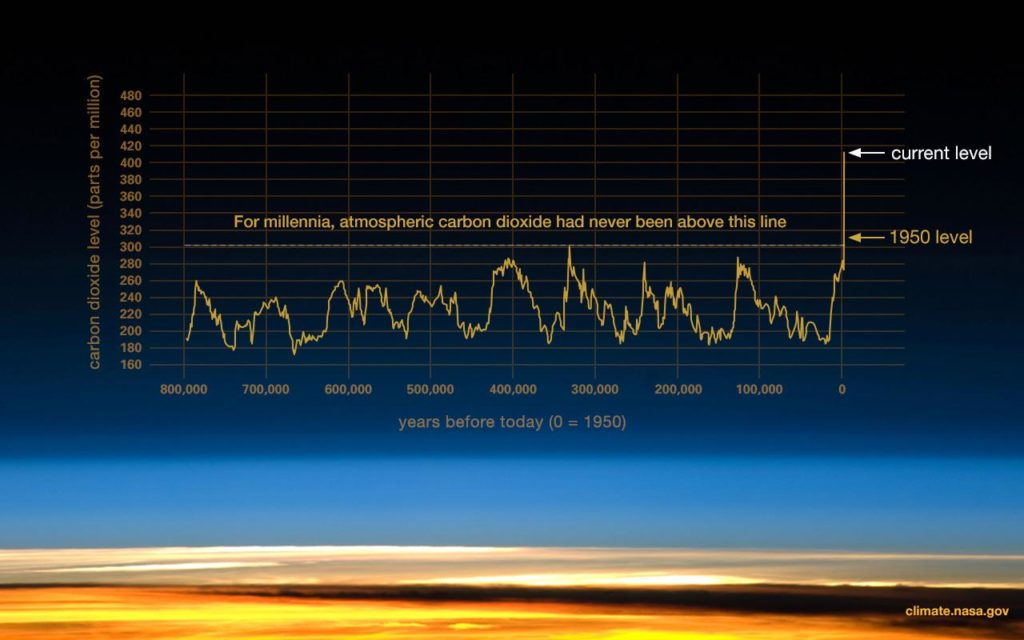
A NASA infographic gives us a glimpse of this: we notice that the concentration of CO2 in the atmosphere has always changed over the last 800,000 years for natural reasons.
Evolution of the atmospheric CO2 concentration / Source: [NASA]
It is therefore true that the planet undergoes cycles (called Milankovic cycles) of about 100,000 years of rising and falling CO2 concentration. This is related to the modification of the orbital parameters of the Earth around the Sun. These modifications warm up the planet more or less and this leads to a release of CO2 into the atmosphere, thus increasing the temperature of the planet.
The current climate disruption phenomenon is different from the Milankovic cycles in 2 ways:
The speed of emission,s about 50 – 100 times faster than in the past.
The causality between CO2 and T°C. Today, the main cause of warming is the increase of GHG in the atmosphere.
The peak in CO2 concentration (on the right of the graph) corresponds to the intensification of human activities since the beginning of the industrial revolution.
What happened then ?
To begin with, our ancestors used coal to run the steam engine, then oil to run combustion engines and finally gas to heat our cities.
As burning 1L of gasoline emits 2.8kg of CO2, all the machines used by mankind emit more and more CO2 into the atmosphere, whether they use gasoline, gas or coal.
All this leads to “increase the thickness of the terrestrial sleeping bag” and thus raising the temperature on Earth.
Burning 1L of gasoline emits 2.8kg of CO2.
The IPCC report published in August 2021 shows with certainty that the current warming is caused by human activities and the emission of greenhouse gases is due to them.
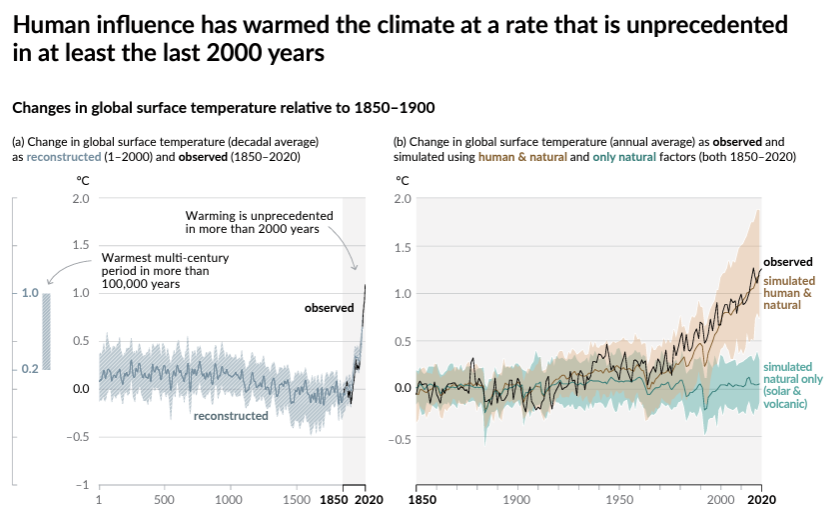
These analyses proposed by the IPCC show the evolution of the Earth’s temperature over the last 2000 years. We notice in particular that the temperature has increased by +1.1°C since 1850 and scenarios predict +5°C by 2100.
NB: During the last deglaciation, the temperature increased by 5°C on a global scale in … 10 000 years. That is to say a warming about 50-100 times slower than the current one.
To illustrate this, we have included graphs of global temperature changes relative to 1850-1900.
The graph on the right compares the evolution of observed temperatures (black curve) with the models taking into account natural factors alone (blue) and human factors combined (orange). It is clearly visible that the observed temperature curve is very close to the simulation integrating natural and human impacts, while on the contrary the only natural simulation is disconnected.
The human factor is therefore the main determinant in the case of global warming.
AR6 Figure SPM.1 [Source : IPCC]
During the last deglaciation, the temperature increased by 5°C on a global scale in … 10 000 years. That is to say a warming about 50-100 times slower than the current one.
In order to mitigate as much as possible the harmful consequences of global warming, it is necessary to reduce the greenhouse gas emissions emitted by our industrial society.
But how do we achieve this reduction in emissions?
As soon as possible.
This reduction must be doneas soon as possible because the planet has warmed up by +1°C and every tenth of a degree counts. Indeed, extreme phenomena linked to climate change (cyclones, droughts, floods) increase with the temperature of the planet. But we must not forget that positive feedback loops can be triggered from a certain temperature threshold.
This is why the reduction must be done as soon as possible. As it seems unlikely that humanity will stop its emissions (of greenhouse gases) overnight, the IPCC carries out its analyses on the basis of scenarios called SSP for Shared Socioeconomics Pathways.
The graphs below represent the reduction effort for different gases and particles that contribute to global warming. It is interesting to note that the blue curves (SSP1-1.9 and SSP1-2.6) are the scenarios that allow to respect the Paris Agreement.
How to reduce our greenhouse gas emissions ?
Note that we choose to talk only about CO2 from now on, for the sake of the length of the article. However, you should know that the reduction effort must also be made on methane, nitrous oxide and other greenhouse gases.
First, let’s look at where our emissions come from.
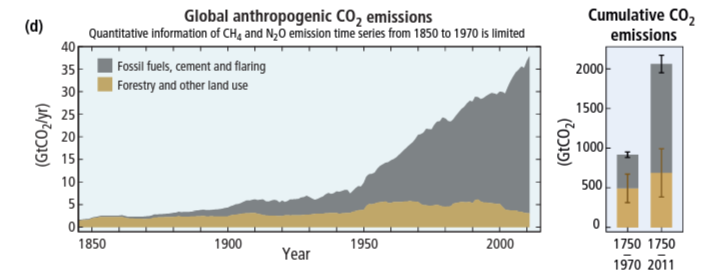
In 2010, humanity emitted about 35 billion tons of CO2, 30 billion of which came from the burning of fossil fuels and the manufacture of cement.
Human (anthropogenic) CO2 emissions are mainly due to the combustion of fossil resources. This combustion can be used for different purposes such as :
To move a vehicle
To heat
To produce electricity
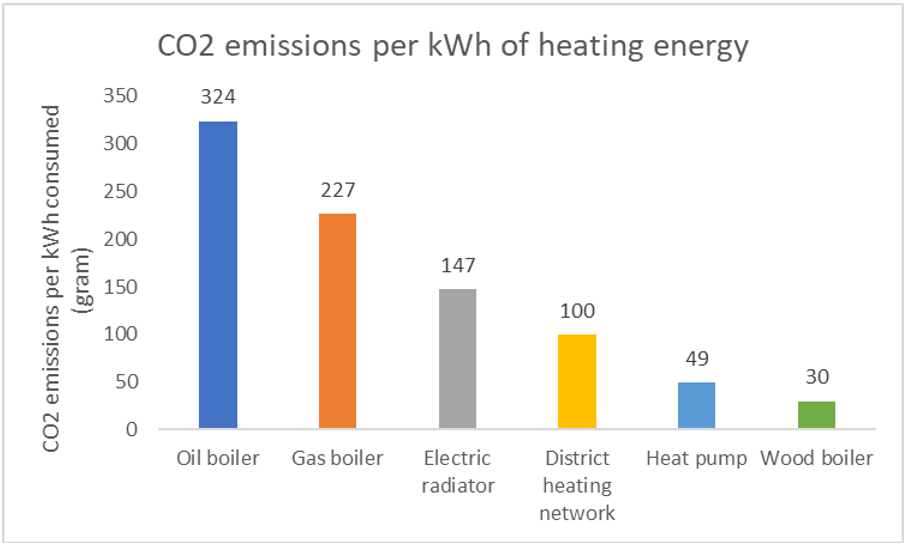
Let’s now compare the different solutions for heating according to a particular axis: the amount of CO2 emitted to produce 1 kWh of heat.
Carbon intensity of heating systems. Source [ author from ADEME datas]
To supply heat we have different solutions. Very often, we heat with oil in the countryside and with gas in the city. The reason being simply that the deployment of a gas network is more economical in dense areas.
Heating methods based on fossil fuels (oil and gas) are the most carbon intensive.
To reduce your carbon impact while having the same service (1 kWh of energy to use), changing your heating mode is a first solution.
Through this example, we see that the choice of our energy sources can have a strong impact on our CO2 emissions. The analysis of the energy mix allows us to quickly get an idea of the CO2 emissions of a country.
As a reminder, the energy mix is the breakdown of the different energies used by a system (often analyzed at the country level).
It is therefore through the prism of energy mixes that we can best address the following question: “how to achieve the energy transition? What are the stakes (economic in particular) in relation to these energy mixes? How have these mixes evolved over time?
In summary: what are the best levers to achieve the energy transition? See you in the next article to find out!
We only use necessary cookies and one cookie to improve your user experience: the one which automatically chooses your language. By continuing your navigation through this website, you're accepting these cookies.

![Photo de l'auteur [Harald Lhomme]](https://caristeo.com/wp-content/uploads/2022/04/hlhomme-pro-noir_et_blanc-buste-1024x987.jpg)